

News
How fast is a DC EV charger?
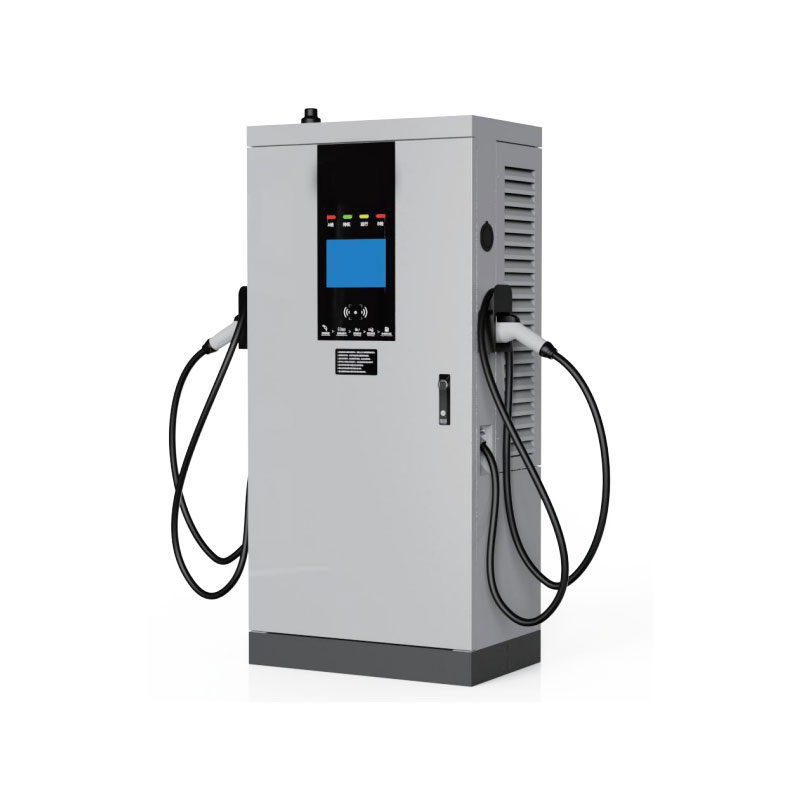
VANTON has spent years building and testing every DC EV Charger we sell, so when customers ask me how fast a session will be, I do not guess—I break it down in plain numbers and real-world behavior. VanTon is specialized in EV charging equipment and accessories in China, supplying a full range of DC fast charger products with high quality and responsive after-service. To keep service consistent and markets stable, we have also established an after-sales service point in Canada. Below I explain speed in ways that help you plan sites, choose hardware, and set realistic expectations for drivers.
What does charging speed actually measure?
-
Power defines the instantaneous rate of energy going into the battery and is expressed in kilowatts kW.
-
Energy added is measured in kilowatt-hours kWh and is what increases state of charge.
-
Session time depends on the average power over the session, not just the headline peak.
Simple estimator
Time hours ≈ Energy added kWh ÷ Average power kW
Average power is usually 60–85% of the charger’s peak due to battery limits, tapering, and cabling losses. That is why a 150 kW unit might average 95–120 kW across a 10–80% session on many mainstream EVs.
Why does a 350 kW label not always deliver 350 kW?
-
Battery acceptance limits Most packs cap at a certain intake even if the charger can supply more.
-
Charging curve characteristics Power is high at mid-SOC and tapers near 80–90% to protect cell longevity.
-
Voltage window compatibility High-voltage 800 V packs can exploit 350 kW hardware better than 400 V packs.
-
Thermal management Battery and cable temperatures can trigger power reductions.
-
Shared power cabinets Some sites dynamically allocate power across multiple posts.
How fast are typical 10–80% sessions across common pack sizes?
The table uses conservative real-world averages rather than theoretical peaks. Figures reflect mainstream 400 V vehicles and modern 800 V vehicles under normal conditions.
| Charger class | Typical peak kW | Realistic average kW | 60 kWh pack 10–80% mins | 77 kWh pack 10–80% mins | 100 kWh pack 10–80% mins |
|---|---|---|---|---|---|
| 60–90 kW urban DC | 80 | 55 | ~45 | ~58 | ~75 |
| 120–150 kW highway | 150 | 105 | ~32 | ~41 | ~53 |
| 180–200 kW highway | 200 | 135 | ~25 | ~32 | ~42 |
| 250 kW high power | 250 | 170 | ~20 | ~26 | ~34 |
| 350 kW ultra fast 400 V pack | 350 | 190 | ~18 | ~23 | ~30 |
| 350 kW ultra fast 800 V pack | 350 | 240 | ~14 | ~18 | ~24 |
How to read it
-
Minutes represent the energy needed to go from 10% to 80% SOC 70% of pack size divided by the average power.
-
Vehicles with 800 V architectures often hold higher power longer, raising the average and cutting time.
What real factors change a driver’s experience day to day?
-
Starting SOC Lower SOC allows higher power initially. Beginning at 40% instead of 10% can add 6–12 minutes.
-
Temperature Cold batteries reduce acceptance until warmed by driving or preconditioning.
-
Cable length and cleanliness Longer or coiled cables produce extra heat and loss. Dirty pins add resistance.
-
Site load If cabinets share power across posts, a busy site can cap your lane at a lower ceiling.
-
Firmware and BMS The right software handshake CCS1 CCS2 CHAdeMO GB T and the vehicle’s BMS logic determine how quickly the session stabilizes.
How do connector standards influence speed today?
-
CCS family supports high currents and higher voltages with robust communication for modern packs.
-
CHAdeMO supports strong reliability on older models but fewer new cars are optimizing for it.
-
GB T DC remains standard in China and supports high power on compatible vehicles.
-
NACS adapters and native NACS posts are expanding in North America while retaining DC fast performance through proper voltage and current negotiation.
Which charger power should a site owner choose for the best ROI?
-
Urban dwell points 60–90 kW often maximizes utilization and grid friendliness where dwell is longer.
-
Highway corridors 150–200 kW balances cost and turn-time for mixed 400 V fleets.
-
Premium flagship sites 250–350 kW attracts 800 V models and future proofs heavy traffic locations.
Quick selection checklist
-
What is the target dwell time per driver
-
What vehicle mix will use the site 400 V or 800 V
-
What grid capacity and transformer budget are available
-
Will cabinets be shared across multiple posts
-
What cooling liquid cooled cables needed above 300 A
How does VANTON verify performance before shipment?
-
Full-load soak tests We run continuous high-current sessions to confirm thermal stability and sustained power.
-
Protocol interoperability We test across CCS CHAdeMO and GB T stacks and verify handshake times.
-
Environmental chambers We validate performance from subzero conditions to peak summer heat.
-
Cable and gun lifecycle Our connectors complete tens of thousands of mating cycles with controlled resistance checks.
-
Field data feedback Our Canadian after-sales point collects usage logs to refine firmware and improve uptime.
What does a sample TCO and revenue scenario look like?
| Scenario | Units | Value |
|---|---|---|
| Charger rating | kW | 150 |
| Average delivered power | kW | 105 |
| Energy per 30 min session | kWh | ~52.5 |
| Sessions per post per day | count | 18 at steady sites |
| Daily energy per post | kWh | ~945 |
| Uptime target | percent | 98% with remote O M |
| Illustrative margin per kWh | USD | 0.10 example only |
| Daily gross margin per post | USD | ~94.50 |
Why it matters
-
Raising average power from 90 to 105 kW cuts session time and increases daily turns without increasing peak demand on every minute of the hour.
-
Proactive cooling, smart load management, and clean connectors protect that average.
How can drivers squeeze the fastest results during a trip?
-
Plan arrival near 10–20% SOC so the car accepts higher power immediately.
-
Precondition the battery via the in-car navigation route to the DC fast charger.
-
Prefer open cabinets rather than a stall that shares capacity with a busy neighbor.
-
Unplug near 80% where tapering accelerates the minutes per kWh cost.
-
Keep the connector pins clean and fully seated before authentication.
What questions should fleet and site planners ask vendors up front?
-
What is the verified sustained power at 35 °C ambient for 20 minutes continuous
-
What is the cabinet to post sharing ratio and can it be configured in software
-
What is the efficiency at 50% load and at 90% load
-
What are the cable cooling specs including max continuous current and duty cycle
-
What remote diagnostics and over the air firmware tools are included
-
What on site spare parts and response times can the service partner guarantee
What does our DC line-up cover today?
-
Power bands from 60 kW compact cabinets to 350 kW ultra fast posts with liquid cooled guns.
-
Single or dual gun configurations with CCS CHAdeMO and GB T options.
-
Modular rectifier design so you can expand a cabinet from 120 kW to 180 or 240 kW as traffic grows.
-
Smart energy features dynamic load sharing scheduled demand management solar and storage integration.
-
Metering options revenue grade certification on request to fit local regulations.
How do we keep uptime high after installation?
-
Preventive maintenance schedules that match site load and climate instead of one generic interval.
-
Hot-swap rectifier modules that minimize downtime to minutes instead of hours.
-
24 7 remote monitoring with fault triage so many issues resolve before a driver ever arrives.
-
Localized parts and technicians via our Canadian after-sales point for North American customers.
What pain points do we solve for site owners and fleets?
-
Uncertain turn-times We publish tested average power curves so you can size queues and staffing.
-
Connector confusion We guide the right mix of CCS CHAdeMO GB T and growing NACS needs.
-
Grid constraints Our cabinets support staged upgrades and dynamic load sharing to fit limited capacity.
-
Service anxiety We commit to transparent SLAs spare parts stocking and local response.
What are the key takeaways you can use immediately?
-
Peak power is not the same as average power and average is what sets real minutes.
-
150–200 kW covers most 400 V fleets efficiently while 250–350 kW shines with 800 V models and flagship sites.
-
Smart site design and thermal management are as important as the label on the front of the cabinet.
-
The right vendor partnership reduces total cost of ownership and protects revenue per stall.
Would you like technical specs and pricing that fit your site plan?
If you need datasheets, dimension drawings, lead times, and after-sales coverage for a VANTON DC EV Charger, my team can share product options and real-world usage references so you can build your own business case with confidence. Tell us your target power, connector mix, and installation location, and we will send the matching models, quotations, and service details. For quotes, distributor inquiries, or partnership requests, please contact us and we will respond promptly.
Related News
- How Fast Can a DC EV Charger Actually Fill Up Your Electric Car Battery?
- Why Is a 60kWh Mobile Charging Station Transforming EV Charging Flexibility?
- Why Is a Tesla Portable EV Charger Essential for Modern Electric Vehicle Owners?
- How Does an AC Wall-Mounted Charger Transform Everyday Electric Vehicle Charging Experience?
- Why Is a 65kWh Mobile Road Rescue Charging Station Essential for Modern EV Emergency Support?
- What is GBT V2L Adapter and Its Role in EV Power Supply?
Leave me a message


